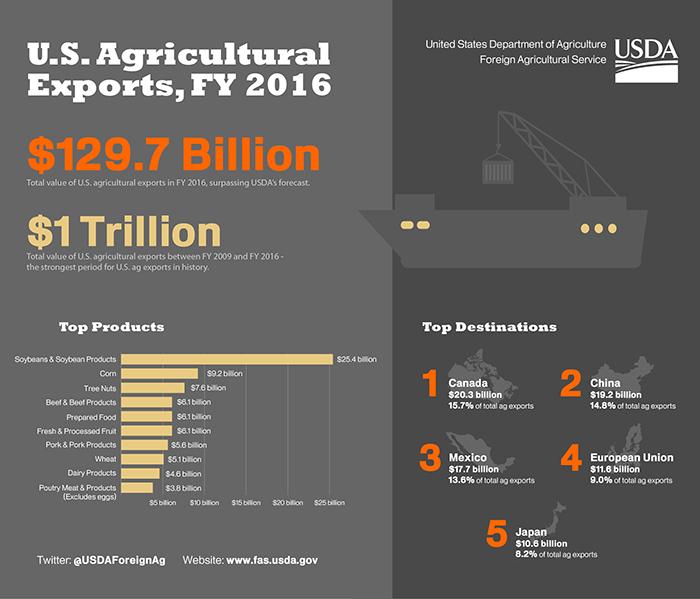
Infographic: U.S. Agricultural Exports, FY 2016
| Charts and Graphs
Database Source:
Related Charts & Graphs
Infographic discussing holiday baking as it relates to 2022 U.S. agricultural export totals and top producing states.
Infographic showing a series of Halloween themed trivia questions related to U.S. agricultural exports.
Infographic highlighting Foreign Agricultural Service accomplishments in 2022.

