
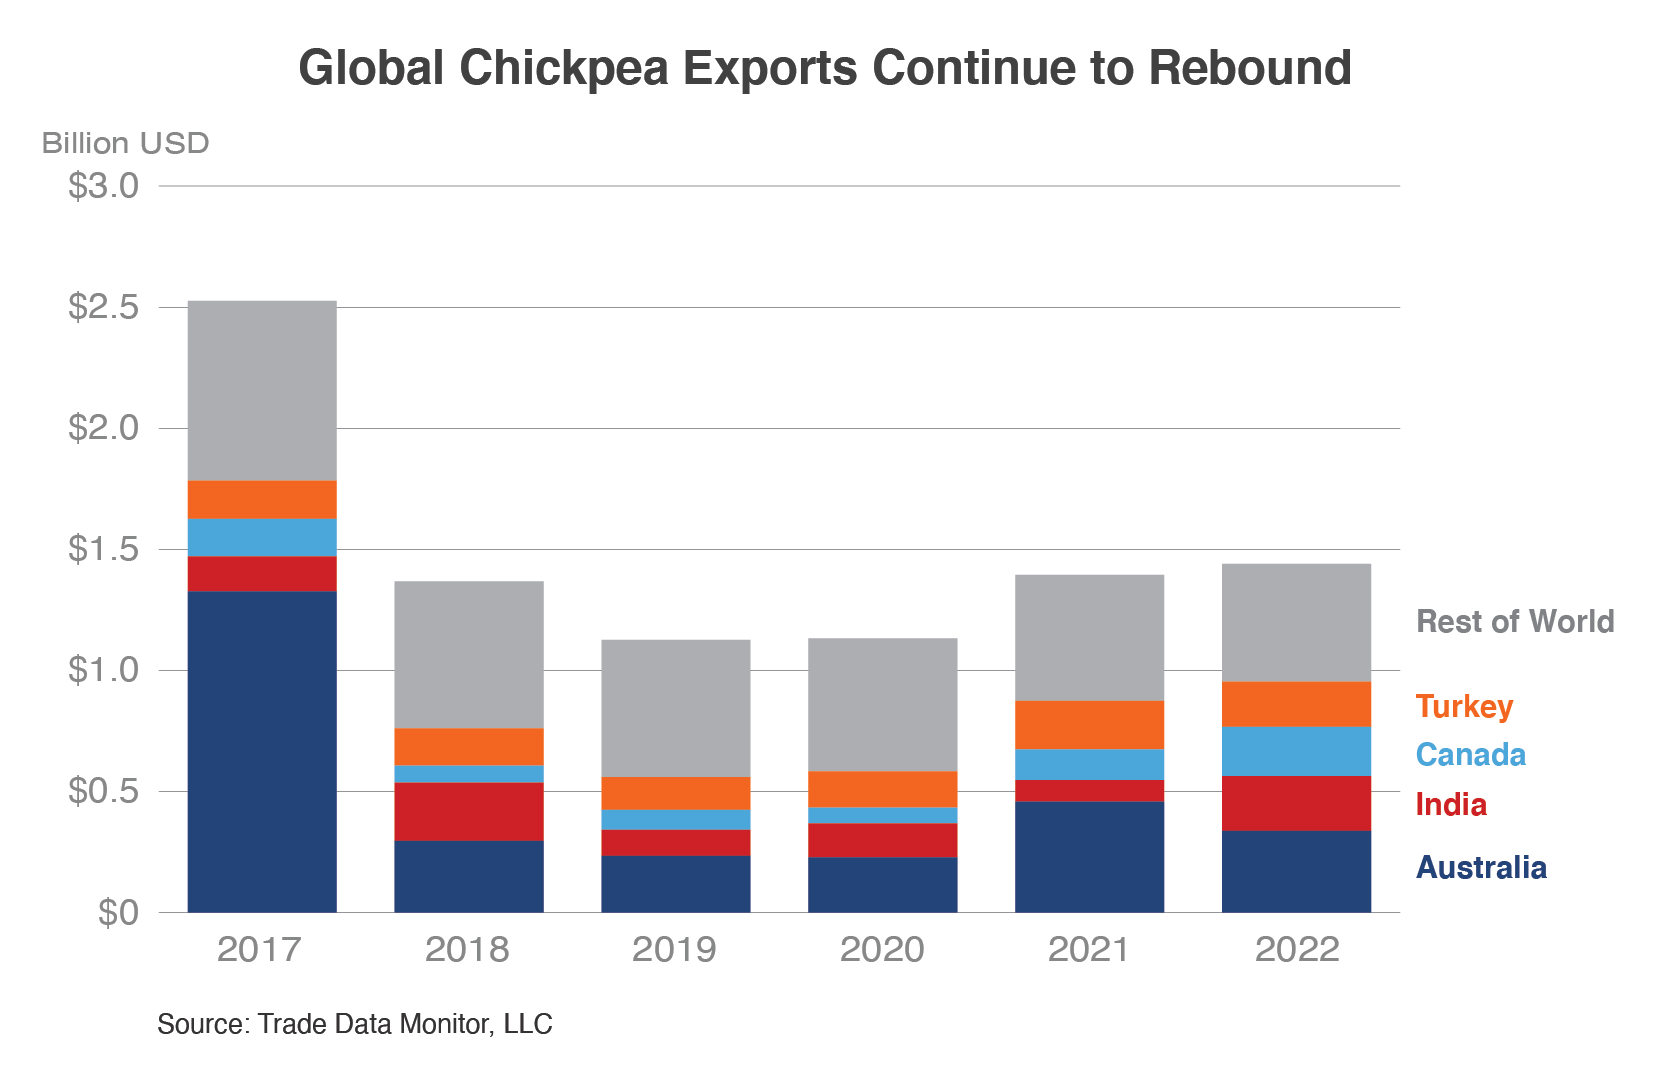
Chickpeas, also known as garbanzo beans, are a legume full of protein, fiber, complex carbohydrates, and are relatively low in calories. Chickpeas are used in many Indian and Mediterranean dishes. Australia, India, and Canada are the top three chickpea exporters accounting for more than 40 percent of the world’s exports in 2022.
Australia
Australia is the largest exporter but not the top producer of chickpeas. Production rose from 813,000 tons in 2012 to 876,000 tons in 2021. However, production grew to 1.3 million tons in 2016 and more than 2.0 million tons in 2017 when India was Australia’s largest market for chickpea exports at more than $1.1 billion, accounting for 62 percent of Australian exports. Exports fell drastically (to less than 1 percent) after India applied tariffs to limit imports. This blow to the Australian chickpea sector emphasized the importance of diversifying export markets. Australia continues to be the largest exporter with approximately one-third of the global exports spanning the past 10 years. Exports totaled $338 million in 2022 with Bangladesh and Pakistan accounting for nearly 80 percent of Australia’s trade even with a drop in exports to both markets from the year before.
India
India was the top chickpea producer in 2021, with production at 11.9 million tons, up by more than 50 percent since 2012. Imports totaled $50 million in 2022, down from $335 million in 2013 and down even further from the record $1.3 billion in 2017. The top supplier in 2022 was Tanzania at $45 million, providing 90 percent of the imports. In June 2019, India imposed retaliatory tariffs on 28 U.S. products including chickpeas, levying additional duties on chickpeas in response to Section 232 National Security Measures on Steel and Aluminum and the termination of India’s Generalized System of Preferences status. The 10 percent retaliatory tariff resulted in U.S. chickpea exports, valued at $6.4 million in 2019, coming to a halt by 2022. Fortunately, India’s retaliatory tariffs were repealed for chickpeas in late September 2023. The U.S. market share was 4 percent before 2019. India exports have been trending up and doubled last year to total $226 million in 2022, with increased exports to the United Arab Emirates and Iran.
Canada
Production in Canada increased from 161,000 tons in 2012 to 214,000 tons in 2020, before falling to 76,000 tons in 2021 due to lower area and yields. Chickpeas are grown primarily in Saskatchewan, which accounts for around 80 percent of production. Canada is a major exporter of chickpeas with shipments growing from $47 million in 2013 to total $203 million in 2022. Canada’s top three export markets (accounting for more than half of Canada’s exports) are: Pakistan at $49 million, the United States at $41 million, and the European Union at $26 million. Canada also imports chickpeas. In 2022, the United States was Canada’s top supplier, shipping $19 million, followed by Australia at $12 million. The two countries combined provide more than 80 percent of Canada’s imports.
Turkey
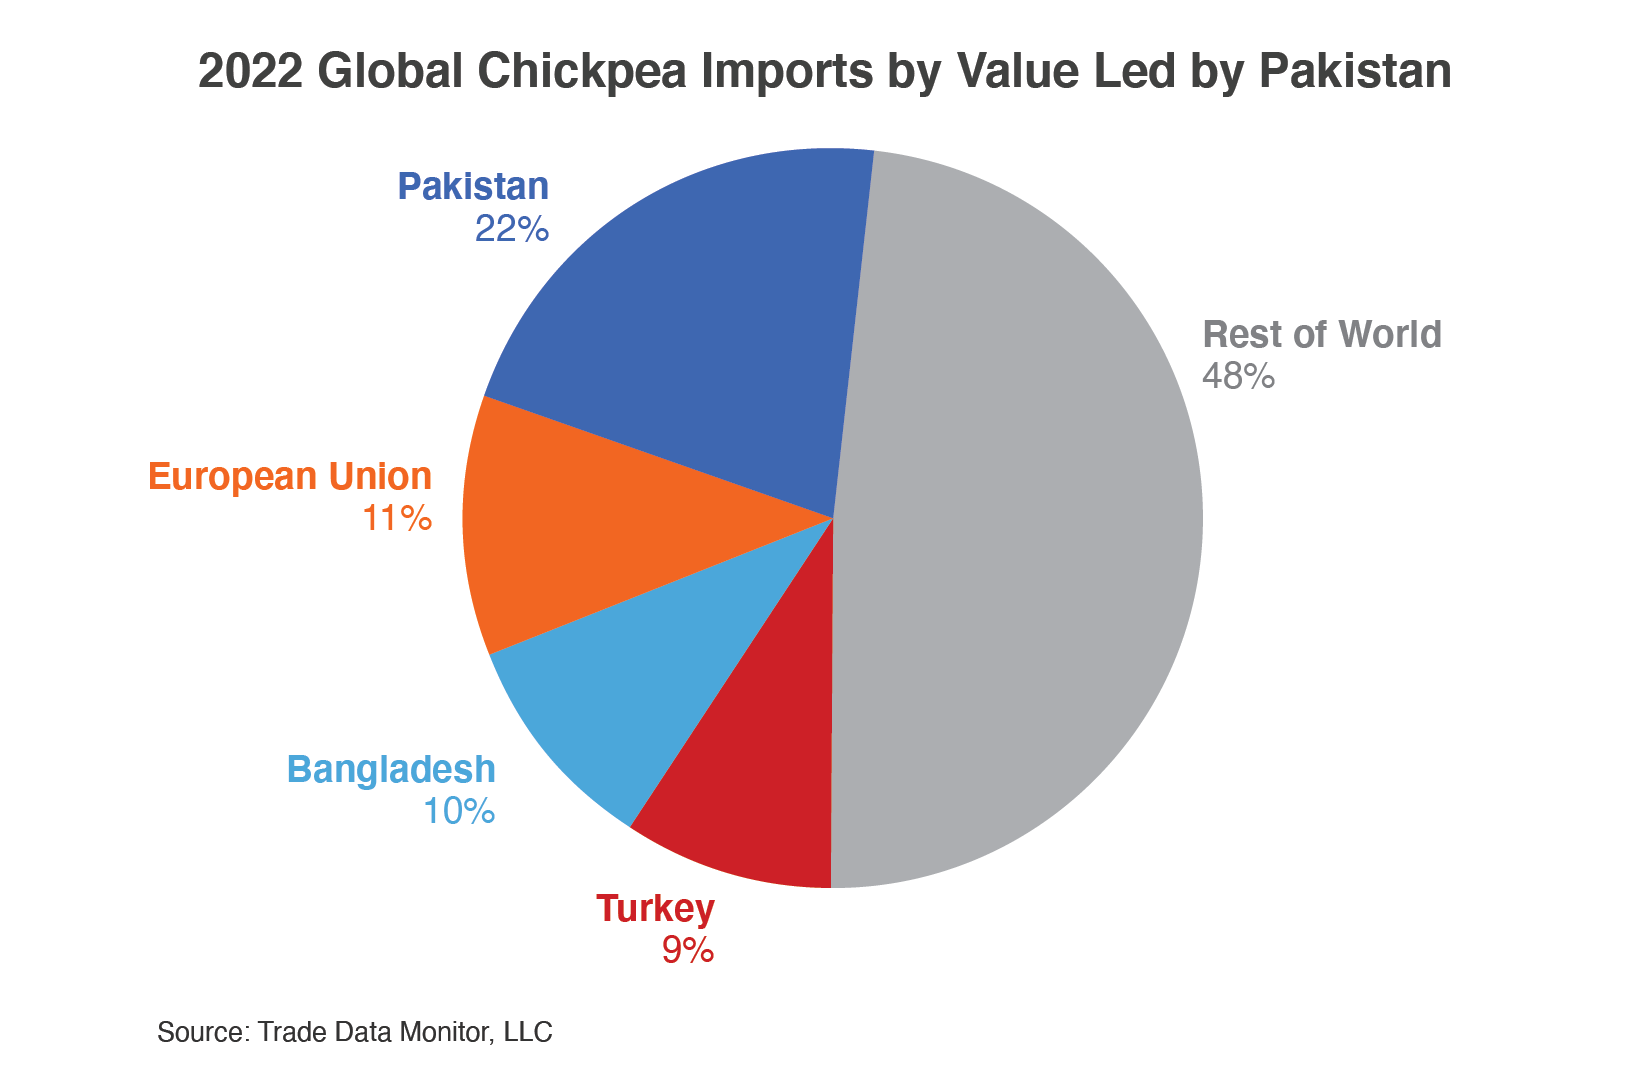
Chickpea production has averaged more than 520,000 tons during the past 10 years. Exports more than doubled during the past 10 years, growing from $76 million in 2013 to $187 million in 2022. Turkey accounted for 9 percent of global imports totaling $109 million in 2022, down from $146 million in 2013. Mexico and Russia accounted for nearly two-thirds of the imports in 2022, dropping 7 percent from the year before on lower shipments from both suppliers.
Pakistan
Production dropped from 751,000 tons in 2013 to 234,000 tons in 2021. During the same period, imports surged from $40 million in 2013 to $262 million in 2022 due to strong domestic demand and lower production. Australia is the largest supplier with nearly half of the trade followed by Canada and Russia, accounting for an additional 30 percent.
European Union
Production of chickpeas in the EU dropped from 38,000 tons in 2012 to 3,200 tons in 2022 due to a drop in area harvested since 2018. The EU was the third largest importer at $137 million in 2022, down from $159 million in 2013. The largest suppliers are Mexico and Turkey, accounting for more than 45 percent of the trade. 2022 imports are up by nearly a third from 2021, because of higher imports from Argentina, Canada, and Russia.
Bangladesh
Production dropped from 7,000 tons in 2012 to 5,000 tons in 2021, which is the last year Food and Agriculture Organization data is currently available. Demand for chickpeas exceeds local production with the difference supplied by imports which have averages approximating 225,000 tons during the past 10 years. Imports more than doubled during the past 10 years to a record $185 million in 2021 due to rising consumer demand. Imports dropped by one-third in 2022 with lower imports from Australia. More than 90 percent of the imports come from Australia.
United States
Chickpea production in the United States increased from 161,000 tons in 2012 to a high of 580,000 tons in 2018 (following record high exports to the European Union and India in 2017) but in 2022 dropped back down to 166,000 tons with the decline in exports after 2017. U.S. chickpea exports grew from $52 million in 2013 to total $169 million in 2017 but declined to $67 million by 2022 in part due to drastically reduced shipments to India. The top three U.S. export markets in 2022 (accounting for two-thirds of U.S. exports) included Canada at $20 million, the European Union at $15 million, and Pakistan at $8 million. Exports in 2022 were down more than 20 percent from the year before due to lower exports to Pakistan as Pakistan imported more from Australia. U.S. chickpea imports have more than doubled during the past 10 years to a record $69 million in 2022 with more than half of the imports coming from Canada.
Global production comes from Food and Agriculture Organization (FAOSTAT) and NASS for U.S. data.
Global trade information is from Trade Data Monitor, LLC, unless otherwise indicated.