
Browse Data and Analysis
Filter
Search Data and Analysis
- 24 results found
- (-) Corn
- (-) May 2024
- (-) March 2018
- Clear all
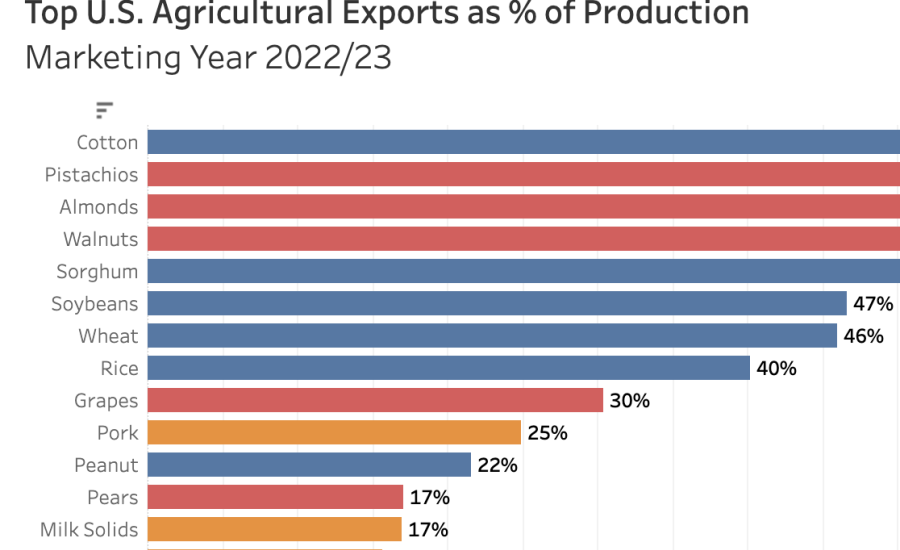
U.S. agricultural exports are a critical source of farm income. The USDA Economic Research Service estimates that on average 23 percent of the output of nonmanufactured agricultural products were exported between 2013 and 2022.
On May 8, 2024, the Ministry of Agriculture and Rural Affairs (MARA) announced the issuance of new and renewed biosafety certificates for genetically engineered (GE) and gene-edited events.
Monthly report on crop acreage, yield and production in major countries worldwide. Sources include reporting from FAS’s worldwide offices, official statistics of foreign governments....
This monthly report includes data on U.S. and global trade, production, consumption and stocks, as well as analysis of developments affecting world trade in grains.
Exporters and importers continue to face much uncertainty due to the military regime’s foreign currency control policies and continuing conflict between the regime and ethnic armed forces. FAS Rangoon forecasts Burma’s MY 2024/25 rice exports to recover to 1.7 MMT amid high stocks and expected relaxation of export controls. MY 2024/25 corn exports and wheat imports will remain flat.
Post forecasts that South Africa’s wheat imports for the 2018/19 MY will decline marginally to 1.8 million tons, on an expected increase in local production.
Peruvian wheat production is all consumed domestically. Wheat imports in MY 2018/19 are forecast at 2.06 MMT.
Wheat consumption in the Dominican Republic (DR) during Marketing Year (MY) 2018/2019 (July 2018/ June 2019) is forecast at 410,000 metric tons (MT), with imports remaining strong at 540,000 MT.
Chile’s wheat planted area for the past ten years has stabilized showing small variations in response to prices and farmers’ short-term expectations.
Pakistan continues to make significant progress towards implementing a full-fledged biotechnology and seed regulatory structure that is expected to facilitate the introduction of new seed....
High prices for Japanese table rice led to Japan’s full utilization of the simultaneous buy and sell quota (100,000 MT), and are expected to lead to continued opportunities in the coming year.
Bar graph showing the top U.S. agricultural exports in 2017. Soybeans was the highest at $21.6 billion, followed by corn and tree nuts.