
Tree Nuts 2021 Export Highlights
Top 10 Export Markets for U.S. Tree Nuts(values in million USD) |
|||||||
| Country | 2017 | 2018 | 2019 | 2020 | 2021 | 2020-2021 % Change | 2017-2021 Average |
| European Union-27 | 2,495 | 2,572 | 2,904 | 2,681 | 2,754 | 3% | 2,681 |
| China | 243 | 328 | 605 | 747 | 978 | 31% | 580 |
| India | 738 | 663 | 823 | 913 | 889 | -3% | 805 |
| Canada | 643 | 696 | 697 | 738 | 716 | -3% | 698 |
| Japan | 398 | 434 | 416 | 386 | 440 | 14% | 415 |
| United Arab Emirates | 301 | 304 | 439 | 308 | 387 | 26% | 348 |
| Korea, South | 306 | 290 | 291 | 295 | 345 | 17% | 305 |
| Mexico | 256 | 371 | 343 | 330 | 333 | 1% | 327 |
| Hong Kong | 1,251 | 1,052 | 692 | 270 | 294 | 9% | 712 |
| Turkey | 308 | 279 | 340 | 250 | 261 | 5% | 288 |
| All Others | 1,541 | 1,528 | 1,524 | 1,483 | 1,483 | 0% | 1,512 |
| Total Exported | 8,479 | 8,515 | 9,074 | 8,400 | 8,882 | 6% | 8,670 |
Source: U.S. Census Bureau Trade Data - BICO HS-10
Highlights
In 2021, the value of U.S. tree nut exports to the world was $8.9 billion, a 6-percent increase from 2020. The top three markets, accounting for 52 percent of sales, were the EU, China, and India at $2.8 billion, $978 million, and $889 million, respectively. Although tree nut exports to India and Canada decreased slightly, this was more than offset by gains to the remaining top 10 markets. With elevated production and stock levels, unit values have remained weak. U.S. exports continue to dominate the global almond, pistachio, and walnut markets with limited competition from Australia (almonds) and Iran (pistachios) as well as China, Chile, and Ukraine (walnuts). The breakout of 2021 tree nut exports were 52 percent almonds ($4.7 billion), 23 percent pistachios ($2.1 billion), 14 percent walnuts ($1.2 billion), 5 percent pecans ($433 million), 4 percent mixed and other nuts ($315 million), and 2 percent hazelnuts ($144 million).
Drivers
- Pistachio exports to top markets including the EU, China, and Hong Kong rebounded as competition from Iran was limited due to reduced output.
- Unit values for tree nuts remain weak which has largely offset export volume increases.
- Despite higher volumes of almond exports to the EU, the value of trade slipped 6 percent to $1.4 billion on lower unit values.
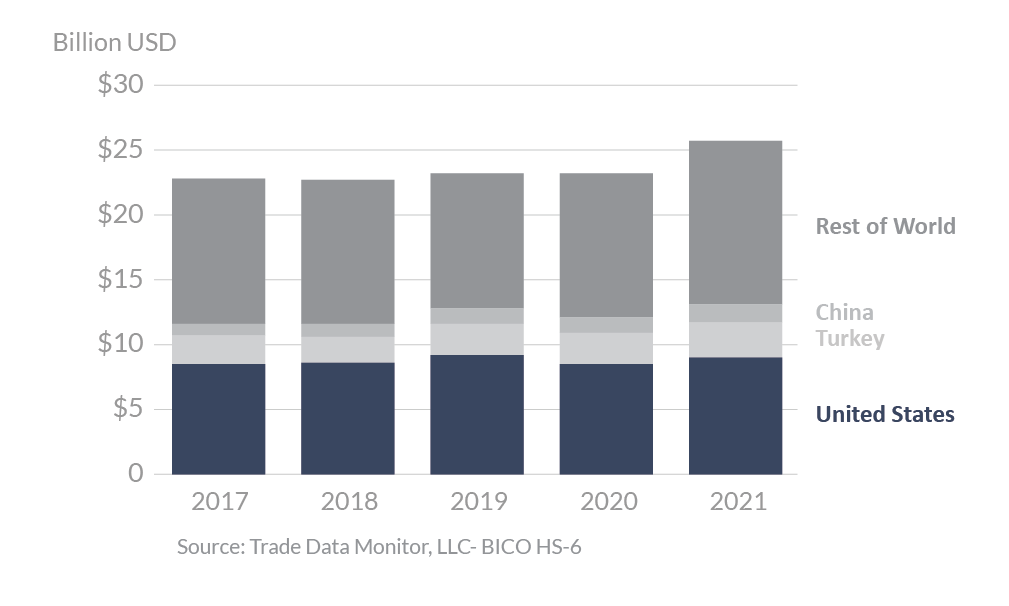
Global Tree Nut Exports
Looking Ahead
Moving forward, the United States is likely to maintain its 80-percent share of world almond production and near 90 percent of trade, with limited competition from Australia. The U.S. walnut industry commands half of world trade, with modest competition from China, Chile, and Ukraine. Although China produces more than 40 percent of the world’s walnuts, their exports only account for about 20 percent of world trade due to variety preferences and strong domestic demand. The U.S. pistachio industry will likely remain in close competition with Iran to be the world’s leading producer and exporter, often trading places depending on conditions affecting yield. New market opportunities for U.S. tree nut exports include countries in Central and South America. The United States has competitive advantages in tree nut production and exports with 10-year growth averaging 7 percent annually; it is well-positioned to maintain its global dominance. Some issues affecting future sales include compliance with pesticide maximum residue levels (MRLs) which has increasingly presented exporters with challenges selling to the EU. The United States continues to advocate for science-based policies that are consistent with WTO commitments. U.S. tree nut producers also face concern over Japan’s stringent enforcement and testing protocol for aflatoxins, which include 100-percent monitoring of imports from the United States.