Taiwan 2019 Export Highlights
Top 10 U.S. Agricultural Exports to Taiwan(values in million USD) |
|||||||
| Commodity | 2015 | 2016 | 2017 | 2018 | 2019 | % Change 2018-2019 |
5-Year Average 2015-2019 |
| Soybeans | 578 | 579 | 586 | 854 | 677 | -21% | 655 |
| Beef & Beef Products | 319 | 363 | 409 | 552 | 567 | 3% | 442 |
| Wheat | 283 | 257 | 295 | 267 | 324 | 21% | 285 |
| Fresh Fruit | 196 | 220 | 218 | 199 | 255 | 28% | 218 |
| Corn | 344 | 460 | 395 | 593 | 227 | -62% | 404 |
| Poultry Meat & Products* | 163 | 127 | 152 | 189 | 187 | -1% | 164 |
| Prepared Food | 161 | 162 | 149 | 154 | 149 | -3% | 155 |
| Cotton | 114 | 119 | 136 | 173 | 130 | -25% | 135 |
| Dairy Products | 72 | 72 | 83 | 93 | 109 | 17% | 86 |
| Tree Nuts | 117 | 82 | 111 | 85 | 90 | 5% | 97 |
| All Other | 804 | 784 | 784 | 789 | 845 | 7% | 801 |
| Total Exported | 3,150 | 3,226 | 3,317 | 3,949 | 3,560 | -10% | 3,441 |
Source: U.S. Census Bureau Trade Data - BICO HS-10
*Excludes eggs
Highlights
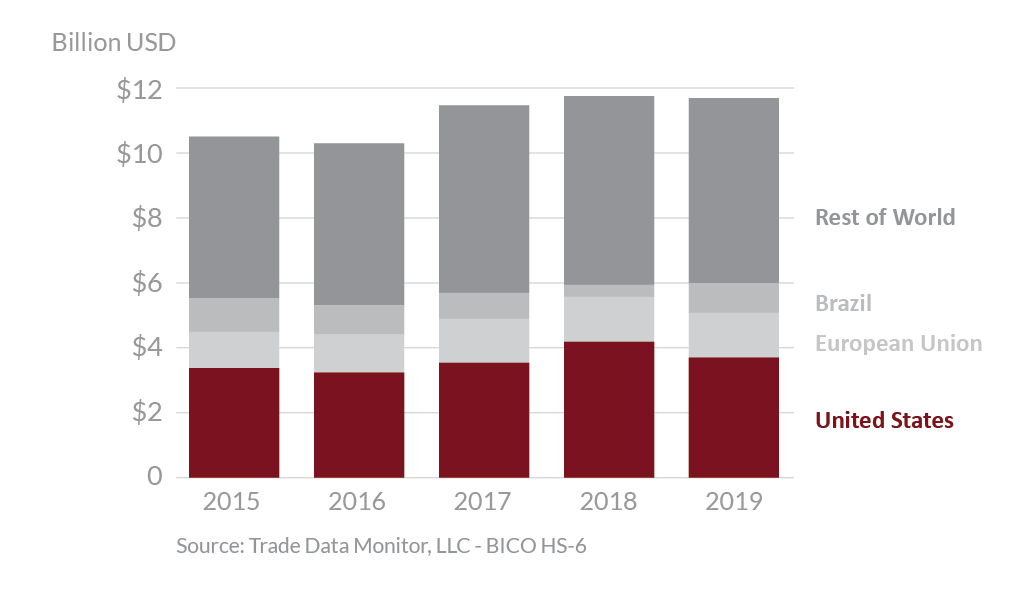
In 2019, Taiwan was the seventh largest destination for U.S. agricultural exports, which totaled $3.6 billion, a 10 percent decrease from 2018. The United States is Taiwan’s top supplier of agricultural goods with 32 percent market share, followed by the European Union with 11 percent. The largest export growth for U.S. product was seen in wheat and fresh fruit, up $57 million and $56 million, respectively. In addition, increases in exports of U.S. live animals, dairy products, and beef and beef products were up $18 million, $16 million, and $15 million, respectively. Exports of U.S. corn decreased by more than $366 million due to higher prices and increased competition from South America and Black Sea regions. Exports of soybeans, cotton, and hides and skins were down $177 million, $44 million, and $9 million, respectively. While Taiwan is one of the largest per capita consumers of U.S. agricultural goods, U.S. food products are facing increased competition from third country competitors with preferential trade agreements.
Drivers
-
As China increased its purchases of U.S. soybeans in 2019, driving up prices, exports to Taiwan retreated from their elevated 2018 levels.
-
U.S. exports of corn were down $365 million from the previous year due to higher prices and increased competition from Brazil, Argentina and Ukraine.
-
Cotton imports were down as China resumed purchases from the U.S. and increased competition from Brazil.
-
Taiwan’s economy remains robust. Its relatively high per capita income drives consumption of high value food products. Taiwan’s economic strength supports its position as an important consumer of U.S. food and agricultural products.
Taiwan's Agricultural Suppliers


Looking Ahead
The onset of COVID-19 disrupted trade and travel throughout East Asia, but Taiwan authorities marshalled a robust response, including economic stimulus measures. However, compounding logistical issues and depressed consumption during the first quarter of 2020 may linger and negatively impact U.S. agricultural exports to Taiwan for the remainder of the year.
Following the January 2020 reelection of President Tsai Ying-wen, Taiwan has expressed interest in enhanced economic cooperation with the United States. Closer integration of these two economies could propel U.S. agricultural exports to Taiwan in 2020 and beyond. Taiwan’s significant retail food sector, dominated by convenience stores, is experiencing rapid growth in fast casual and coffee and tea establishments. This sector drives many of Taiwan’s fastest growing imports based on changes to consumption patterns. Changing consumer preferences and eating habits provide continued opportunity to U.S. exporters in higher value agricultural commodities and consumer-oriented food products.
