Fresh Fruits and Vegetables 2019 Export Highlights
Top 10 Export Markets for U.S. Fresh Fruits and Vegetables(values in million USD) |
|||||||
| Country | 2015 | 2016 | 2017 | 2018 | 2019 | % Change 2018-2019 |
5-Year Average 2015-2019 |
| Canada | 3,520 | 3,441 | 3,487 | 3,417 | 3,463 | 1% | 3,465 |
| Mexico | 683 | 602 | 705 | 760 | 803 | 6% | 711 |
| South Korea | 386 | 401 | 505 | 510 | 419 | -18% | 444 |
| Japan | 392 | 481 | 413 | 426 | 402 | -6% | 423 |
| Taiwan | 264 | 318 | 292 | 278 | 326 | 17% | 296 |
| EuropeanUnion | 187 | 234 | 246 | 247 | 217 | -12% | 226 |
| Hong Kong | 299 | 292 | 302 | 248 | 205 | -17% | 269 |
| Vietnam | 59 | 67 | 72 | 103 | 140 | 36% | 88 |
| China | 140 | 189 | 226 | 177 | 119 | -33% | 170 |
| Australia | 117 | 117 | 118 | 118 | 112 | -5% | 116 |
| All Others | 912 | 869 | 896 | 966 | 851 | -12% | 899 |
| Total Exported | 6,960 | 7,010 | 7,262 | 7,250 | 7,057 | -3% | 7,108 |
Source: U.S. Census Bureau Trade Data - BICO HS-10
Highlights
In 2019, the value of U.S. fresh fruit and vegetable exports to the world reached $7.1 billion, a three percent decline from the prior year. Due to geographic proximity and climate, Canada remained the top U.S. market, accounting for 49 percent of exports, or $3.5 billion. Mexico came in as a distant second with 11 percent of U.S. exports while no other markets had more than 6 percent share of exports. U.S. orange exports experienced the greatest drop, down $100 million from 2018 and accounting for 34 percent of the overall decline, with the largest losses in South Korea, Canada, and China. U.S. orange production is still recovering from the poor harvest of 2018/19 and declining production due to citrus greening. Trade tensions contributed to a second year of decline in fruit and vegetable exports to China and Hong Kong. However, Taiwan and Vietnam saw significant gains of 17 and 36 percent, respectively, valued at $47 million and $37 million. Apples, pears, peaches, citrus, table grapes, and cherries continue to make up half of total U.S. fresh fruit and vegetable exports.
Drivers
-
Top fresh vegetable export commodities included lettuce, potatoes, sweet potatoes, onions, and cauliflower, which accounted for a combined $1.0 billion, with top markets including Canada, Mexico, Japan, and Taiwan.
-
Top fresh fruit export commodities included apples, grapes, oranges, and cherries, which accounted for a combined $2.2 billion, with top markets including Canada, Mexico, South Korea, Japan, and Taiwan.
-
Fruit and vegetable export products faced retaliatory tariffs from China ranging from 15 to 50 percent on fruits and 5 to 35 percent on vegetables. India imposed an additional 20 percent tariff on U.S. apples in June 2019, bringing the total tariff rate to 70 percent.
-
Excessively stringent pesticide maximum residue levels (MRLs) on U.S. fruits and vegetables continued to challenge exporters selling to the EU and South Korea. The United States continues to advocate for compliance with science-based CODEX guidelines.
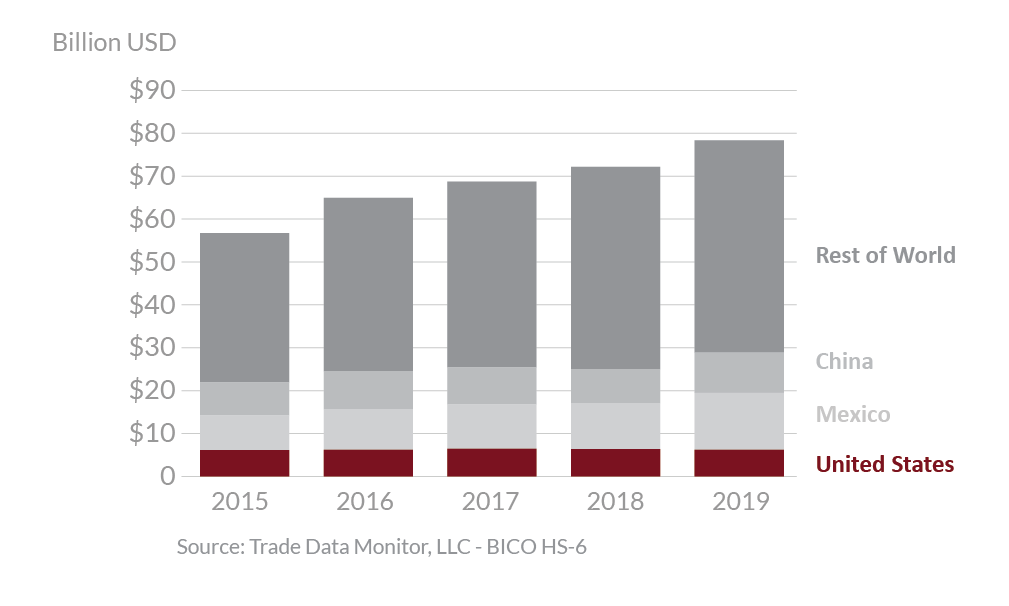
Global Fresh Fruit and Vegetable Exports

Prior to the COVID-19 outbreak, U.S. apple production was expected to rise on improved output in Washington state. Exports are also forecast up on higher shipments to top market Mexico, boosted by the removal of the 20-percent retaliatory tariff in May 2019. U.S. table grape production is forecast to remain steady based on good growing conditions so far this season. Despite good quality supplies, lower demand from Mexico is expected to reduce exports in 2020. Cherry exports are projected to decline for the second straight year unless China’s retaliatory tariffs are lowered or removed. New growth markets for fresh fruit and vegetables include Brazil, Ecuador, and Indonesia. Over the last 10 years, the growth rate for fresh vegetables has been steady on the strength of shipments to Mexico and Canada, while fresh fruit exports continue to decline from their 2013 peak, primarily due to lower table grape, apple, and orange shipments. In 2020, South Korea implemented a positive list system for pesticide MRLs, after providing several years for interested producers and exporters to submit pesticide approval applications. If permanent standards are not established before transition-period temporary MRLs expire in December 2021, the U.S. horticultural industry could face a major trade barrier to South Korea. Taiwan and China also present challenges with MRLs. USDA continues to advocate with its foreign counterparts for a predictable, transparent, and science-based process for setting MRLs and import tolerances.
