Egypt 2019 Export Highlights
Top 10 U.S. Agricultural Exports to Egypt(values in million USD) |
|||||||
| Commodity | 2015 | 2016 | 2017 | 2018 | 2019 | % Change 2018-2019 |
5-Year Average 2015-2019 |
| Soybeans | 162 | 100 | 365 | 1,164 | 995 | -14% | 557 |
| Wheat | 101 | 20 | 34 | 25 | 185 | 656% | 73 |
| Feeds & Fodders | 153 | 79 | 70 | 84 | 78 | -8% | 93 |
| Beef & Beef Products | 154 | 99 | 72 | 66 | 76 | 16% | 94 |
| Dairy Products | 44 | 29 | 36 | 31 | 45 | 49% | 37 |
| Tree Nuts | 29 | 32 | 10 | 24 | 32 | 37% | 25 |
| Cotton | 40 | 34 | 36 | 55 | 31 | -43% | 39 |
| Vegetable Oils* | 44 | 51 | 48 | 34 | 30 | -13% | 41 |
| Live Animals | 6 | 6 | 4 | 4 | 9 | 128% | 6 |
| Planting Seeds | 7 | 10 | 9 | 4 | 8 | 105% | 8 |
| All Other | 312 | 282 | 87 | 424 | 71 | -83% | 235 |
| Total Exported | 1,052 | 741 | 770 | 1,914 | 1,561 | -18% | 1,208 |
Source: U.S. Census Bureau Trade Data - BICO HS-10
*Excludes soybeans
Highlights
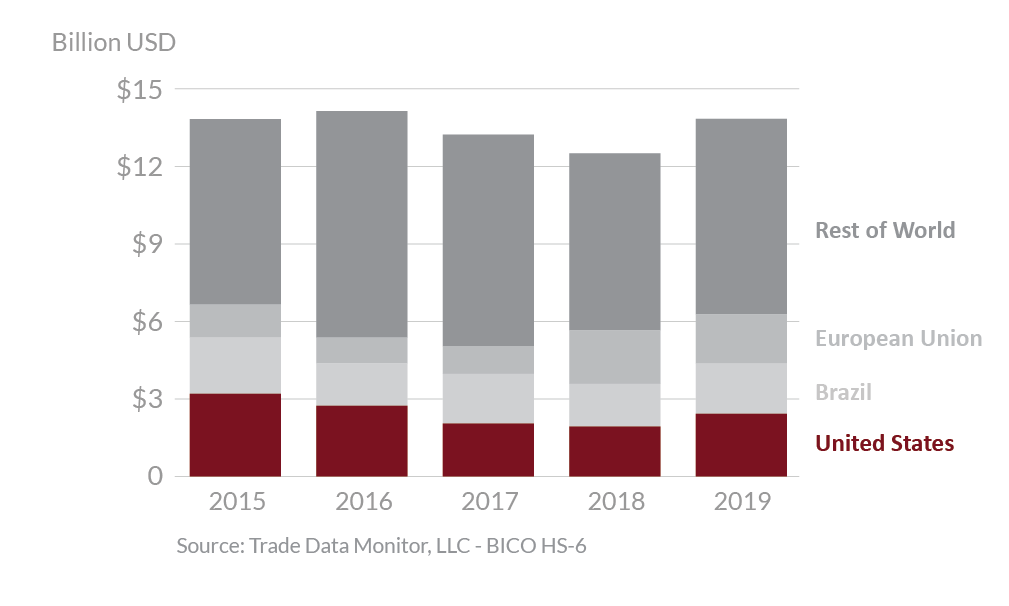
In 2019, Egypt was the 15th largest destination for U.S. agricultural exports, which totaled $1.6 billion, an 18 percent decrease from 2018. The United States is expected to be the fourth largest agricultural supplier to Egypt with 11 percent market share, just behind the European Union (EU) with 16 percent and Brazil with 13 percent. Exporters from the United States face competition from the EU member states which have a geographical advantage, lower shipping rates and a free trade agreement which provides preferential tariffs to EU-origin products. The largest export growth for the United States was seen in wheat and dairy products, up $161 million and $15 million, respectively. Additionally, increases in exports of beef & beef products, tree nuts, and live animals were up $10 million, $9 million, and $5 million, respectively. Exports of corn were down by more than $320 million. Exports of soybeans, cotton, and tobacco were down $168 million, $24 million, and $16 million, respectively.
Drivers
-
Wheat exports were up $160 million to its highest level since 2013. U.S. wheat benefitted from a period of price competitiveness early in 2019 that allowed for a resurgence in exports to price-sensitive markets such as Egypt.
-
Soybean exports to Egypt remained strong in spite of coming off the 2018 record export value, thanks to an early first quarter surge which accounted for much of the year’s exports.
-
Egypt imported no corn from the U.S. in 2019 after imports of $320 million the year before. Higher U.S. prices compared to competitors in South America and Black Sea were responsible for the dramatic drop in U.S. corn exports.
-
Strong economic growth and lower unemployment continued to spur imports of consumer- oriented goods such as beef, dairy and tree nuts.
Egypt's Agricultural Suppliers


Looking Ahead
Prior to the COVID-19 outbreak, strong economic growth and an expanding middle class were expected to continue to make Egypt a growing market for U.S. agricultural goods. Once the pandemic is resolved, tourism is expected to continue to improve and drive an increase in imports of higher value consumer goods such as beef and beef products and dairy products. The HRI sector was forecast to grow by 15-20 percent by 2021 as tourism continued to rebound. With a high population growth, Egypt continues to rely on imports for over 50 percent of its food and agricultural product needs.
