
Browse Data and Analysis
Filter
Search Data and Analysis
- 14 results found
- (-) Tree Nuts
- (-) Charts and Graphs
- Clear all
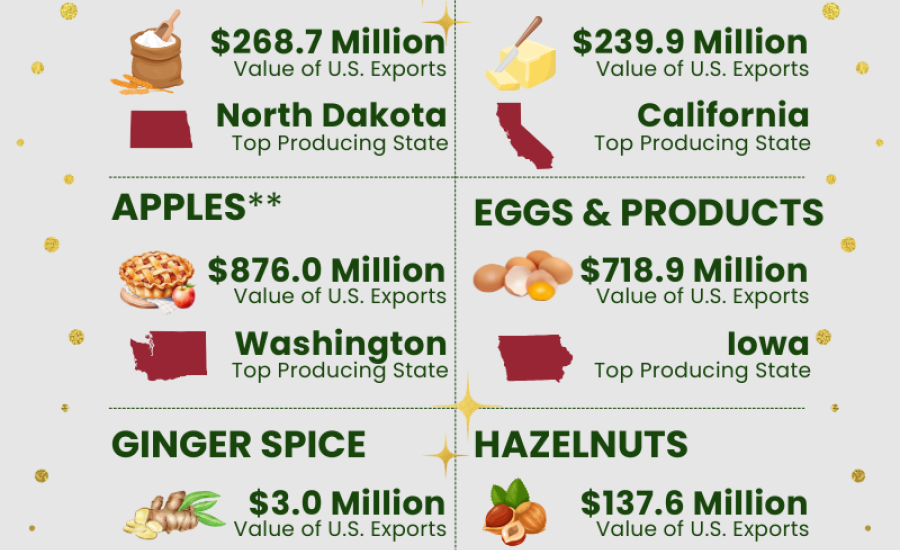
Infographic discussing holiday baking as it relates to 2022 U.S. agricultural export totals and top producing states.
A look at how U.S. agricultural exports performed in 2020.
Graphic showing the percentage of U.S. agricultural production which is exported overseas. All told, more than 20 percent of U.S. agriculture is exported.
Bar graph showing the top U.S. agricultural exports in 2017. Soybeans was the highest at $21.6 billion, followed by corn and tree nuts.
Infographic illustrating the state of U.S. tree nut exports which topped $7.4 billion in 2016.
U.S. farm and food exports climbed eight percent in FY 2017, reaching the third-highest level on record.
Line graph comparing U.S. agricultural trade to and from India. In 2016, the U.S. imported $2.1 billion, while exporting $1.3 billion worth of agriculture.
Graphic illustrating the distribution of India's agriculture imports from the world, which topped $16.9 billion in 2016.
Graphic illustrating the top U.S. agricultural exports to India from 2006-2016.
Infographic discussing U.S. agricultural trade to India which topped $1.3 billion in 2016.
Infographic showing highlights of U.S. agricultural exports to European Union, which totaled $11.6 billion in 2016.
Bubble charting show what percentage of each commodity grown in the United States is ultimately exported to overseas markets.