
Browse Data and Analysis
Filter
Search Data and Analysis
- 17 results found
- (-) Processed Food Products
- (-) Charts and Graphs
- Clear all
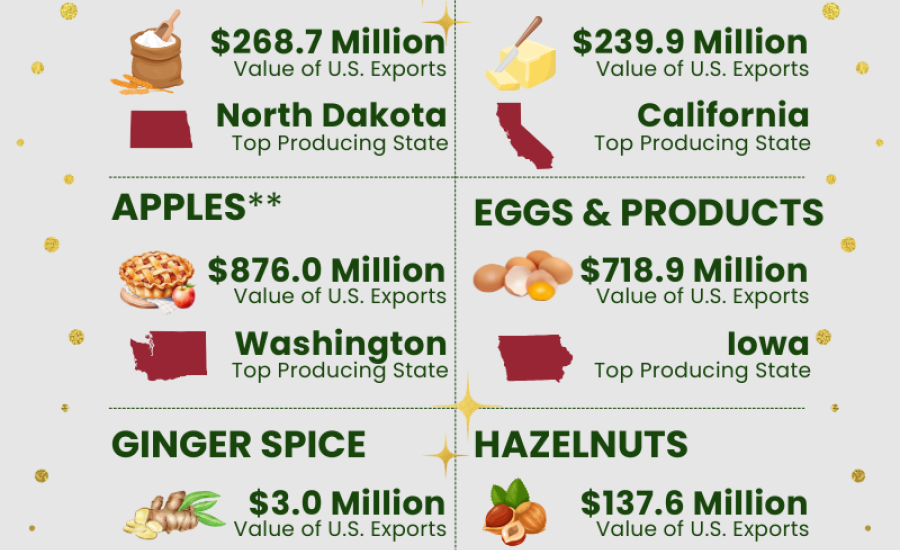
Infographic discussing holiday baking as it relates to 2022 U.S. agricultural export totals and top producing states.
Infographic showing a series of Halloween themed trivia questions related to U.S. agricultural exports.

A look at how U.S. agricultural exports performed in 2020.
Bar graph showing the top U.S. agricultural exports in 2017. Soybeans was the highest at $21.6 billion, followed by corn and tree nuts.
Infographic showing U.S. agricultural exports to Panama in 2016. Total U.S. agricultural exports reached $670 million.
Graphic showing 5 key facts about U.S. cranberry exports which reached $314 million in 2016.
U.S. farm and food exports climbed eight percent in FY 2017, reaching the third-highest level on record.
Graphic illustrating the top U.S. agricultural exports to India from 2006-2016.
Infographic discussing U.S. agricultural trade to India which topped $1.3 billion in 2016.
Infographic showing highlights of U.S. agricultural exports to European Union, which totaled $11.6 billion in 2016.
Infographic showing highlights of U.S. agricultural exports to Canada, which totaled $20.5 billion in 2016.
Infographic showing highlights of U.S. agricultural exports to Mexico, which totaled $17.9 billion in 2016.